Install StreamAlive for your PowerPoint slides
Learn moreImpact Visualization Training for L&D Leaders
StreamAlive helps 9x the audience engagement in your Virtual Instructor-led Trainings (VILT) directly inside your powerpoint presentation.
Make your instructor-led Impact Visualization training more fun with polls, word clouds, spinner wheels and more
Works inside your existing PowerPoint presentation
Install the StreamAlive app for PowerPoint and see your slides come to life as people participate in your interactions
AI generates audience interactions for you
Let our AI scan your presentation and automatically come up with relevant questions based on the content. Or spend two hours coming up with your own questions, your choice!
Built to work with MS Teams and Zoom
Native apps for Teams and Zoom so you never have to leave your existing workflows
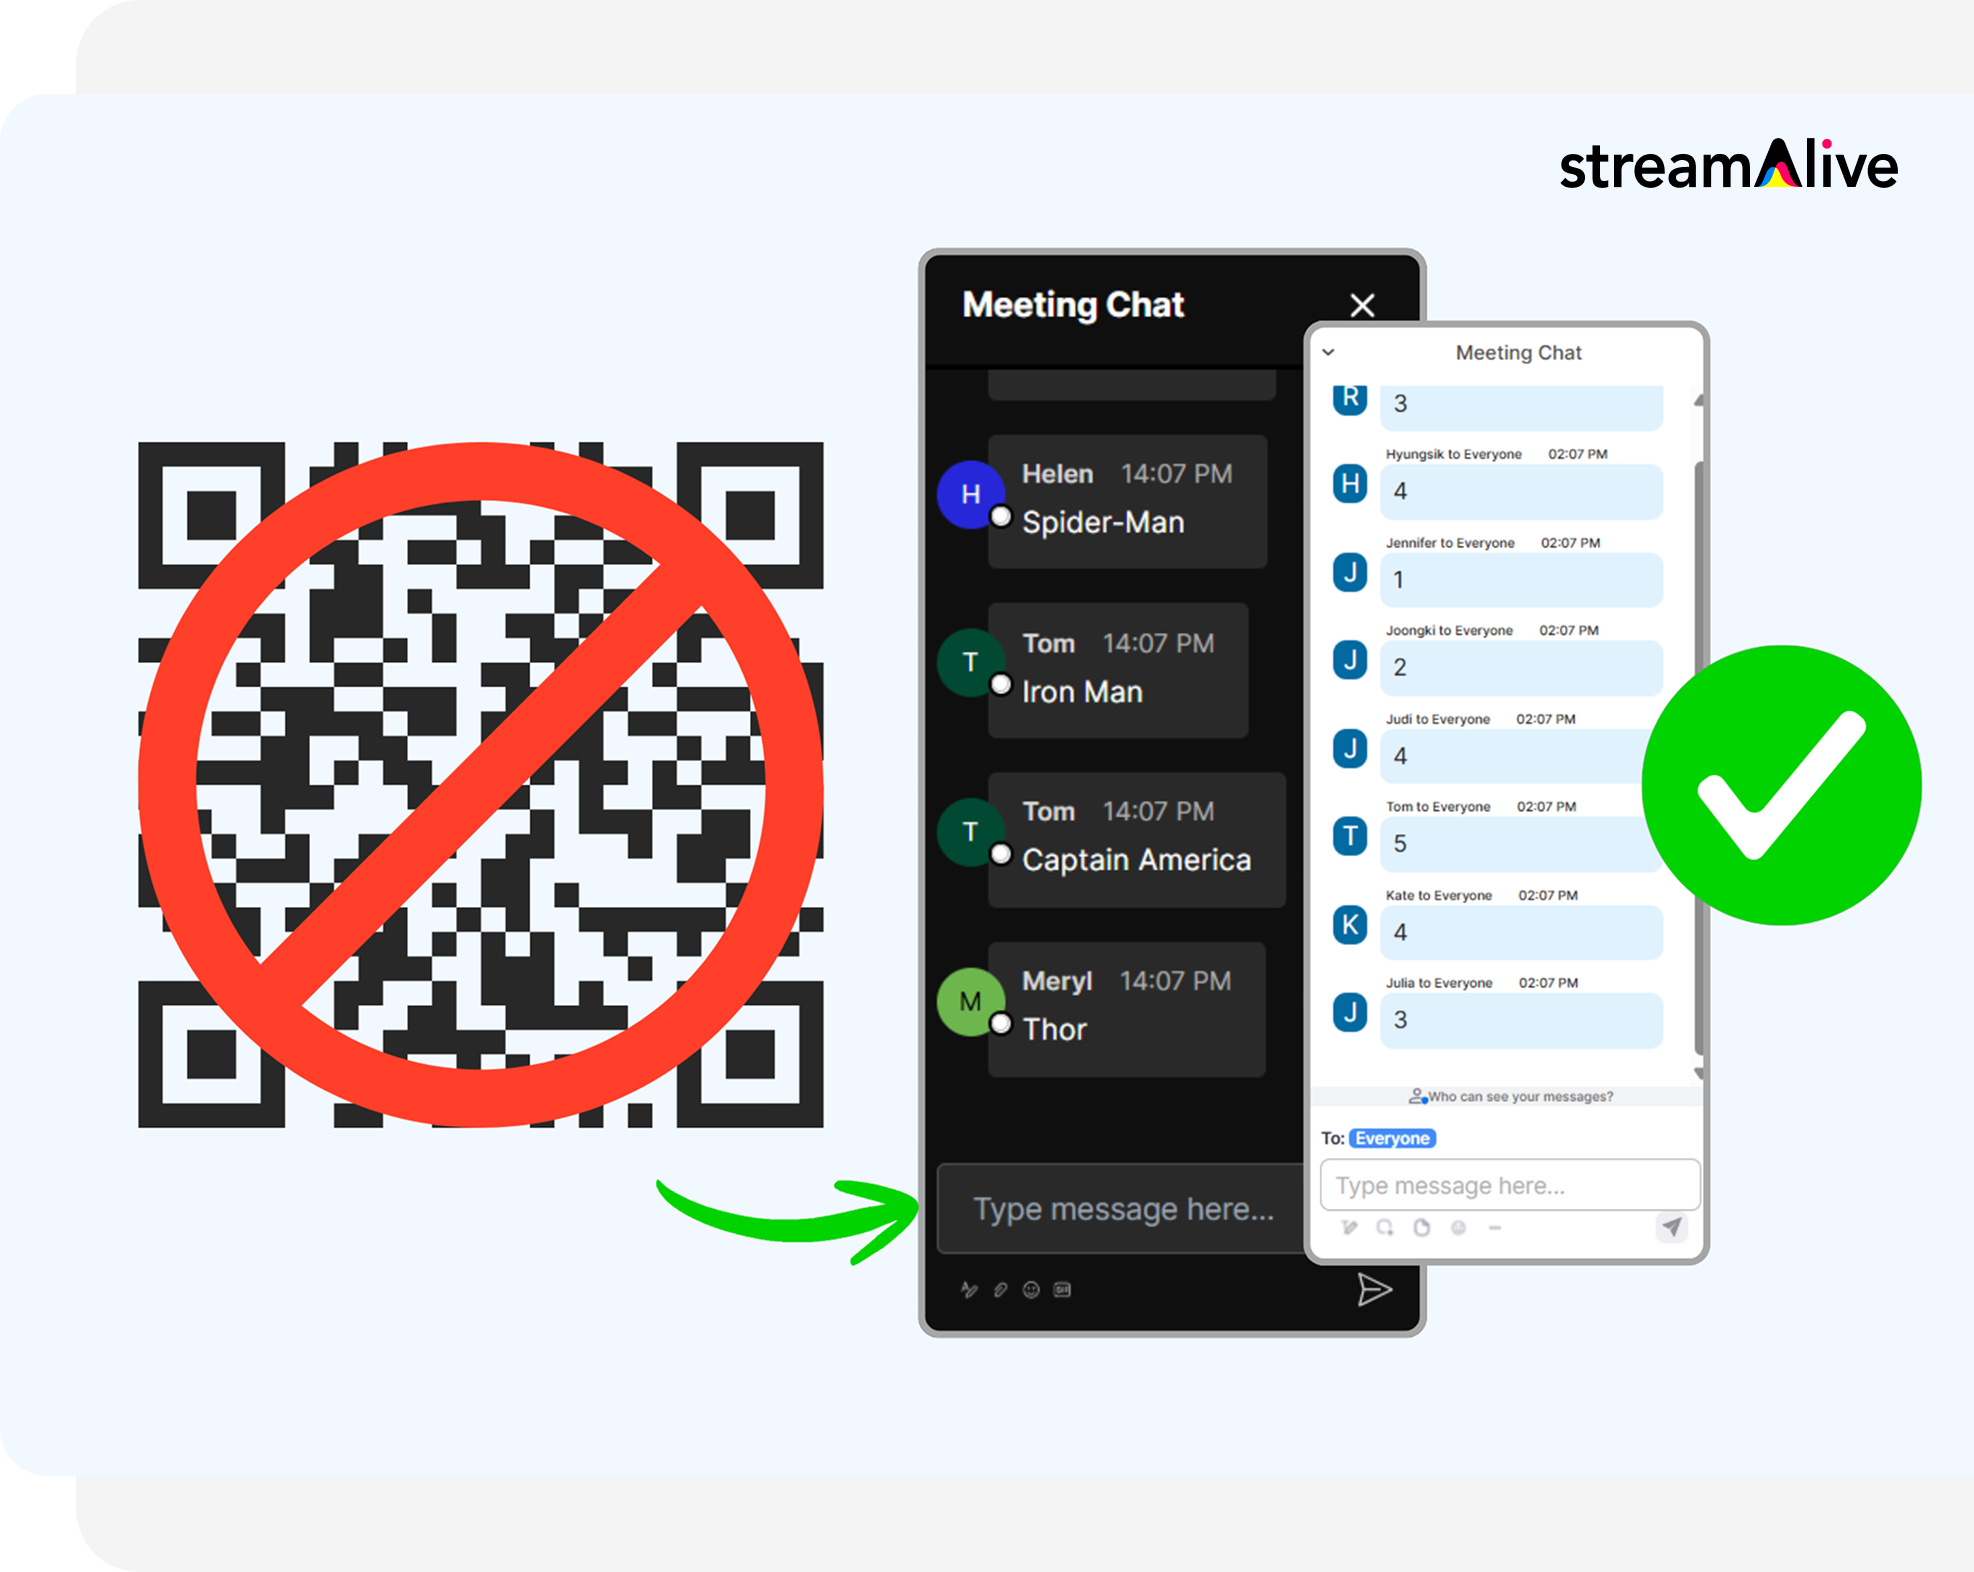
No QR Codes
Chat-powered interactions means your audience doesn’t need to scan QR codes or look at another screen to participate. They just type in the chat!
Quickly approved by your IT team
StreamAlive’s apps for Teams and Zoom means that they have been through rigorous quality assurance and client safety reviews. You’ll find everything an IT team needs to approve the app within the organization within your StreamAlive account.
Youve been asked to run an Impact Visualization instructor-led training for L&D Leaders-and you want it to be more than slides and polite nods. The goal is simple: keep people involved, talking, and thinking out loud. Here are practical ways to do it with StreamAlive so your engagement stays high from minute one.
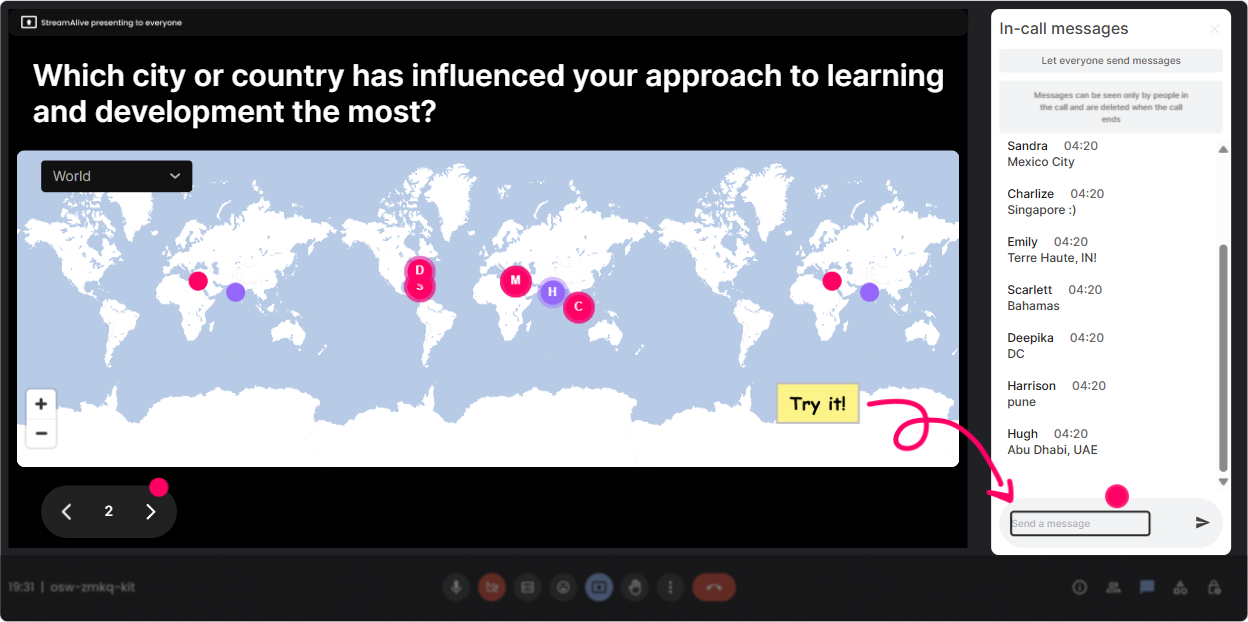
1) Magic Maps: Put your L&D leaders on the map (literally)
This is the easiest way to break the ice without the awkwardness. Instead of Where are you joining from? and then ignoring the answers, you turn it into a live visual that everyone instantly pays attention to. How to use it in Impact Visualization training: - Kickoff question: Where are you joining from today? (classic, but it works-because the map makes it fun.) - Make it relevant: If you could visit any organization on Earth thats *crushing* learning impact, where would you go? (they type a city/country, you get a map full of dream benchmarks.) - Personal connection: Which city shaped your leadership style the most? (great for stories and connection early on.) Trainer tip: If youre expecting one location per person, set it to one entry per attendee so the map doesnt get messy. And when clusters pop up (like 20 people from London), call it out-people love being part of the big dot.
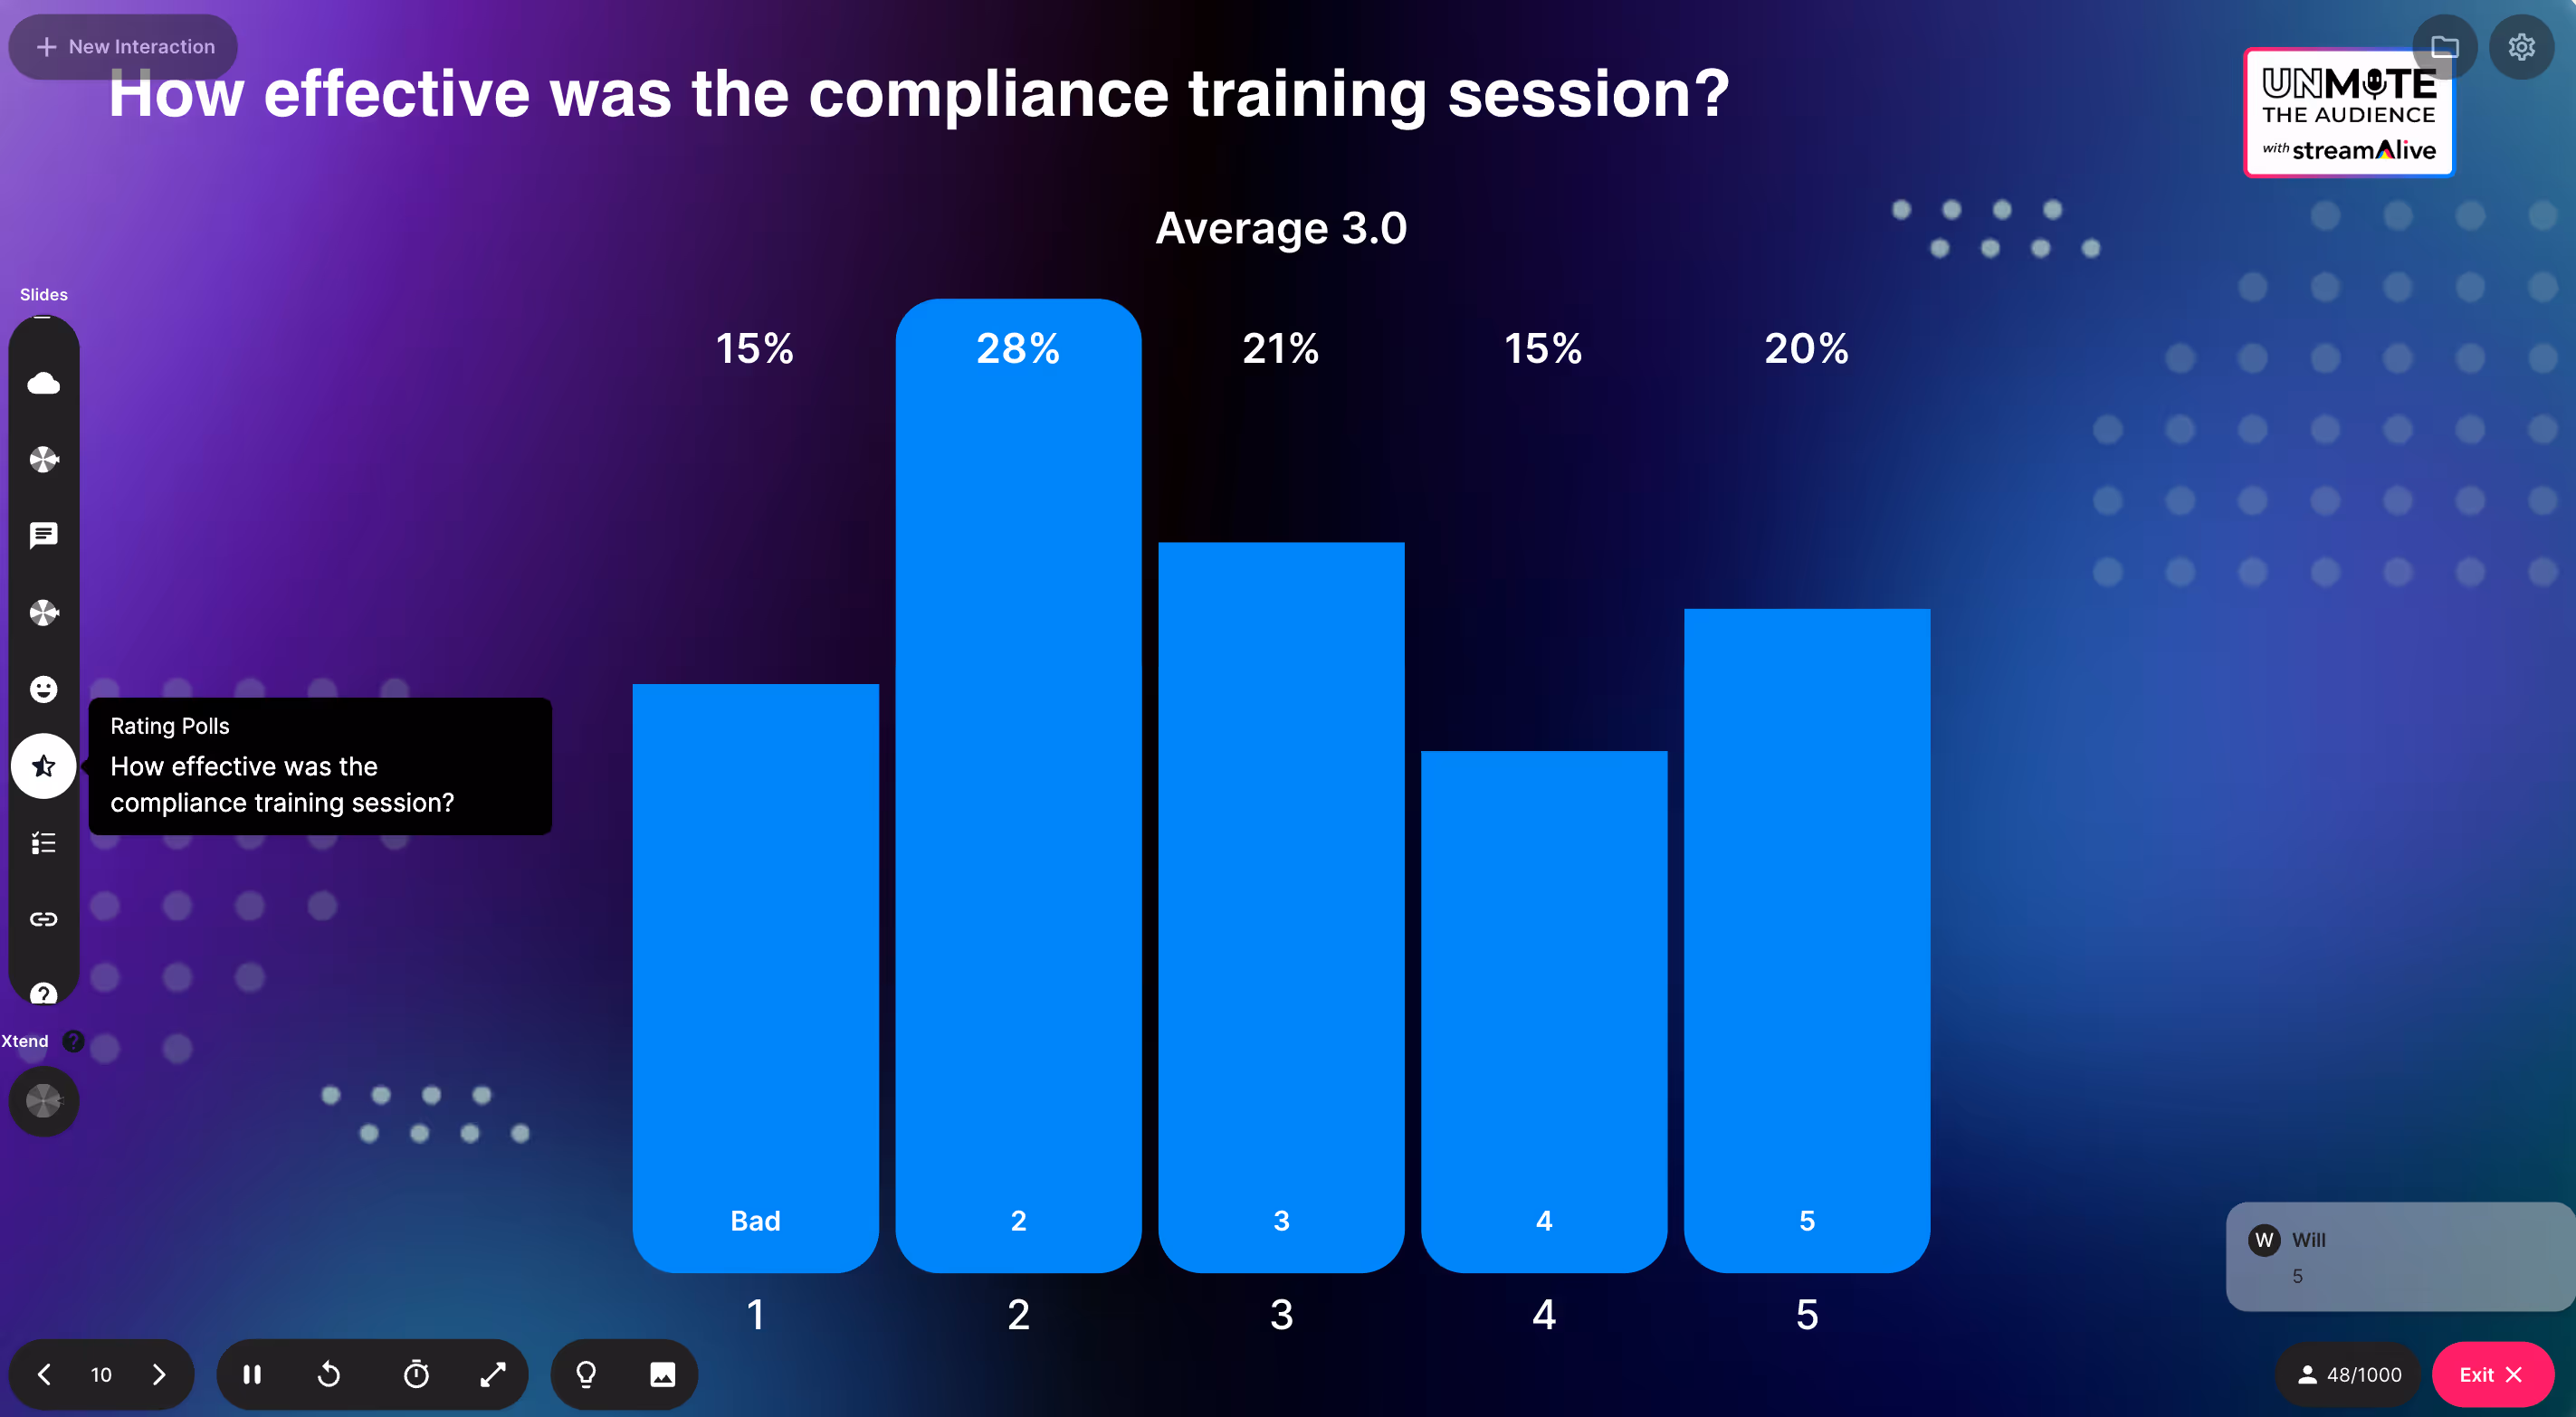
2) Rating Polls: Quick pulse check on how confident people feel
Rating Polls are your best friend when you want instant truth without putting anyone on the spot. Youll quickly see if the room is already confident, totally new, or split-which helps you pace the session. How to use it in Impact Visualization training: - Opening baseline: On a scale of 110, how confident are you in *visualizing learning impact* today? - Mid-session check: How clear is the difference between outputs vs outcomes right now? (1 = still fuzzy, 10 = crystal clear) - After an activity: How ready are you to use Impact Visualization with your stakeholders next week? (110) Trainer tip: When you see a wide spread (some 2s and some 9s), say it out loud: Cool-this tells me weve got a mixed room, so Ill explain it two ways. That one sentence builds trust fast.
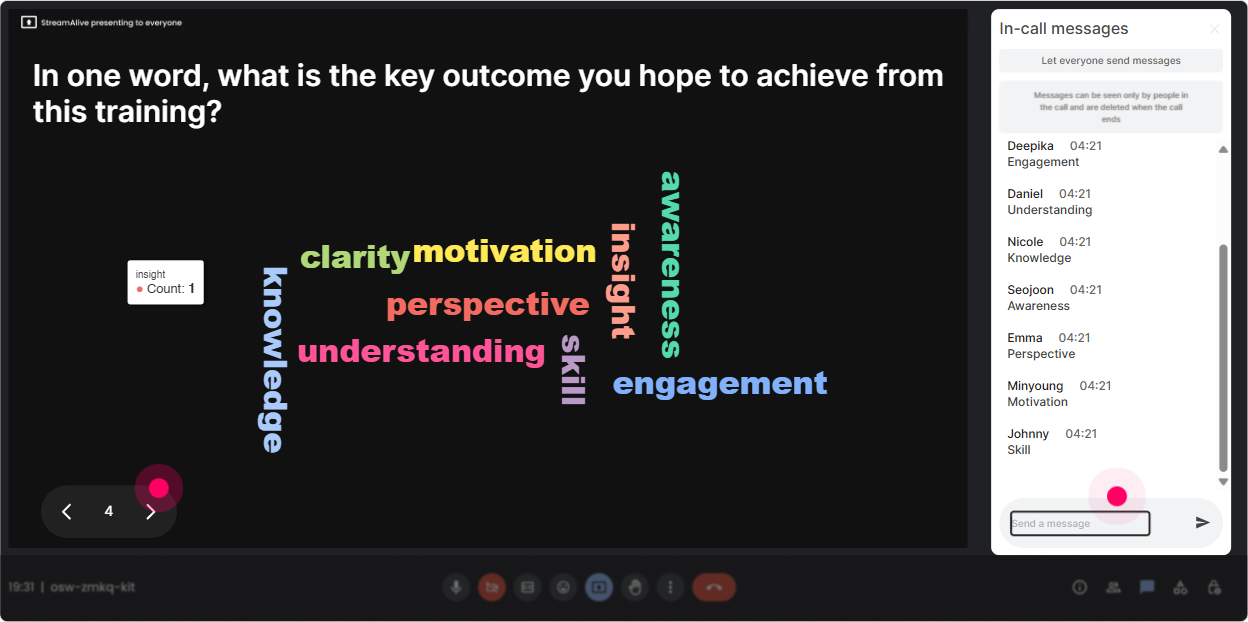
3) Wonder Words (Word Cloud): Get the rooms mood and mental model in 30 seconds
Word Clouds are perfect for surfacing feelings, assumptions, and common challenges-without making people write paragraphs. You ask a one- or two-word prompt, and suddenly youve got a live read on whats happening in their heads. How to use it in Impact Visualization training: - Emotional temperature: Impact Visualization feels ____. (youll get words like exciting, overdue, confusing, political, hard. All useful!) - Pain points: One thing that blocks L&D impact conversations in your org? (expect: data, alignment, time, leadership, budget.) - Outcome language: What word do your execs care about most? (youll see themes like revenue, retention, risk, productivity.) Trainer tip: Use Combine Similar Answers so buy-in and stakeholder buy in dont show as separate items. Then react to the biggest word: Okay-alignment is huge here. Lets make sure today solves for that.
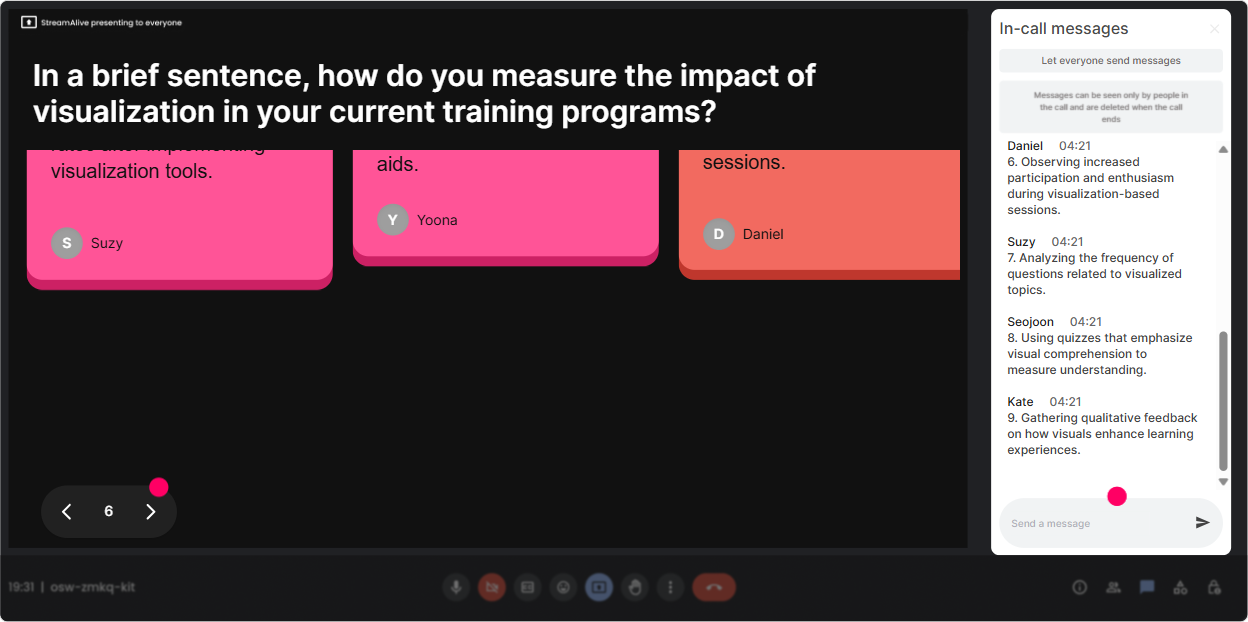
4) Talking Tiles: Turn responses into a visible brainstorm (without awkward silence)
Talking Tiles are awesome when you want richer answers than a couple words-but you still want energy and movement on screen. Responses show up like falling tiles, which makes people actually want to contribute. How to use it in Impact Visualization training: - Role impact question: In your role, where do you most need to *prove* impact-leaders, managers, employees, or customers? And why? - Real-world scenario: Tell me one training program you *wish* you could visualize impact for (and what success would look like). - Stakeholder reality check: Whats the toughest question a stakeholder asks you about L&D value? Trainer tip: Once a few tiles drop in, read 23 out loud and group them: Im seeing a lot of leadership wants ROI and managers want performance proof. Great-our examples today will cover both. Thats how you make people feel seen.
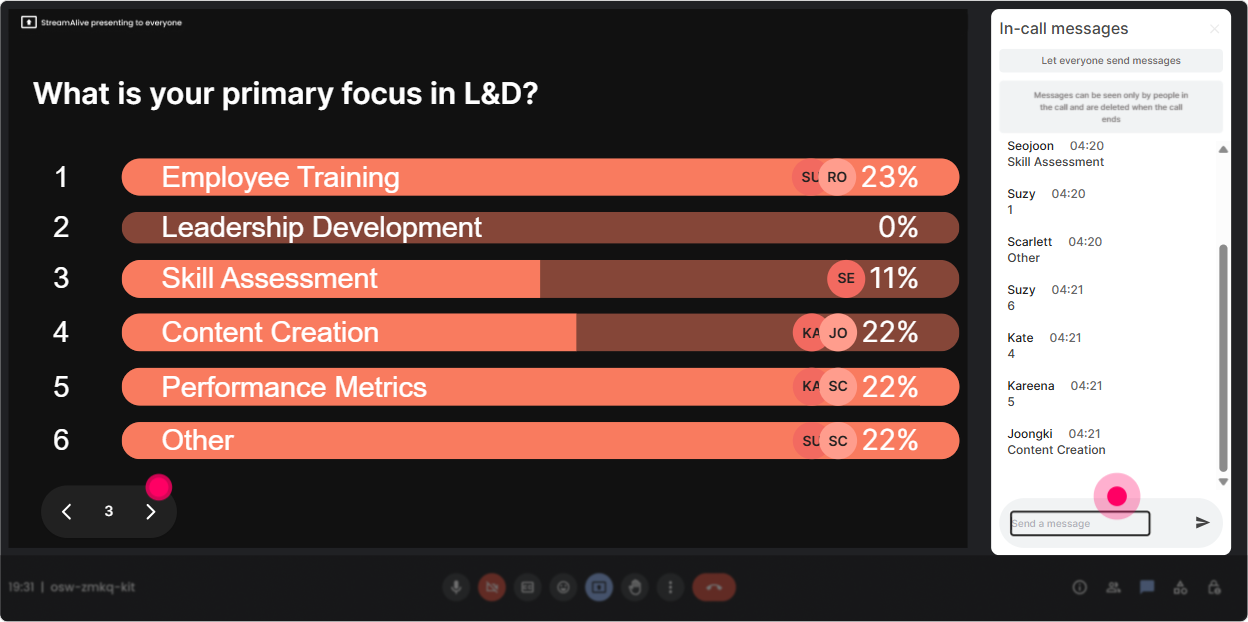
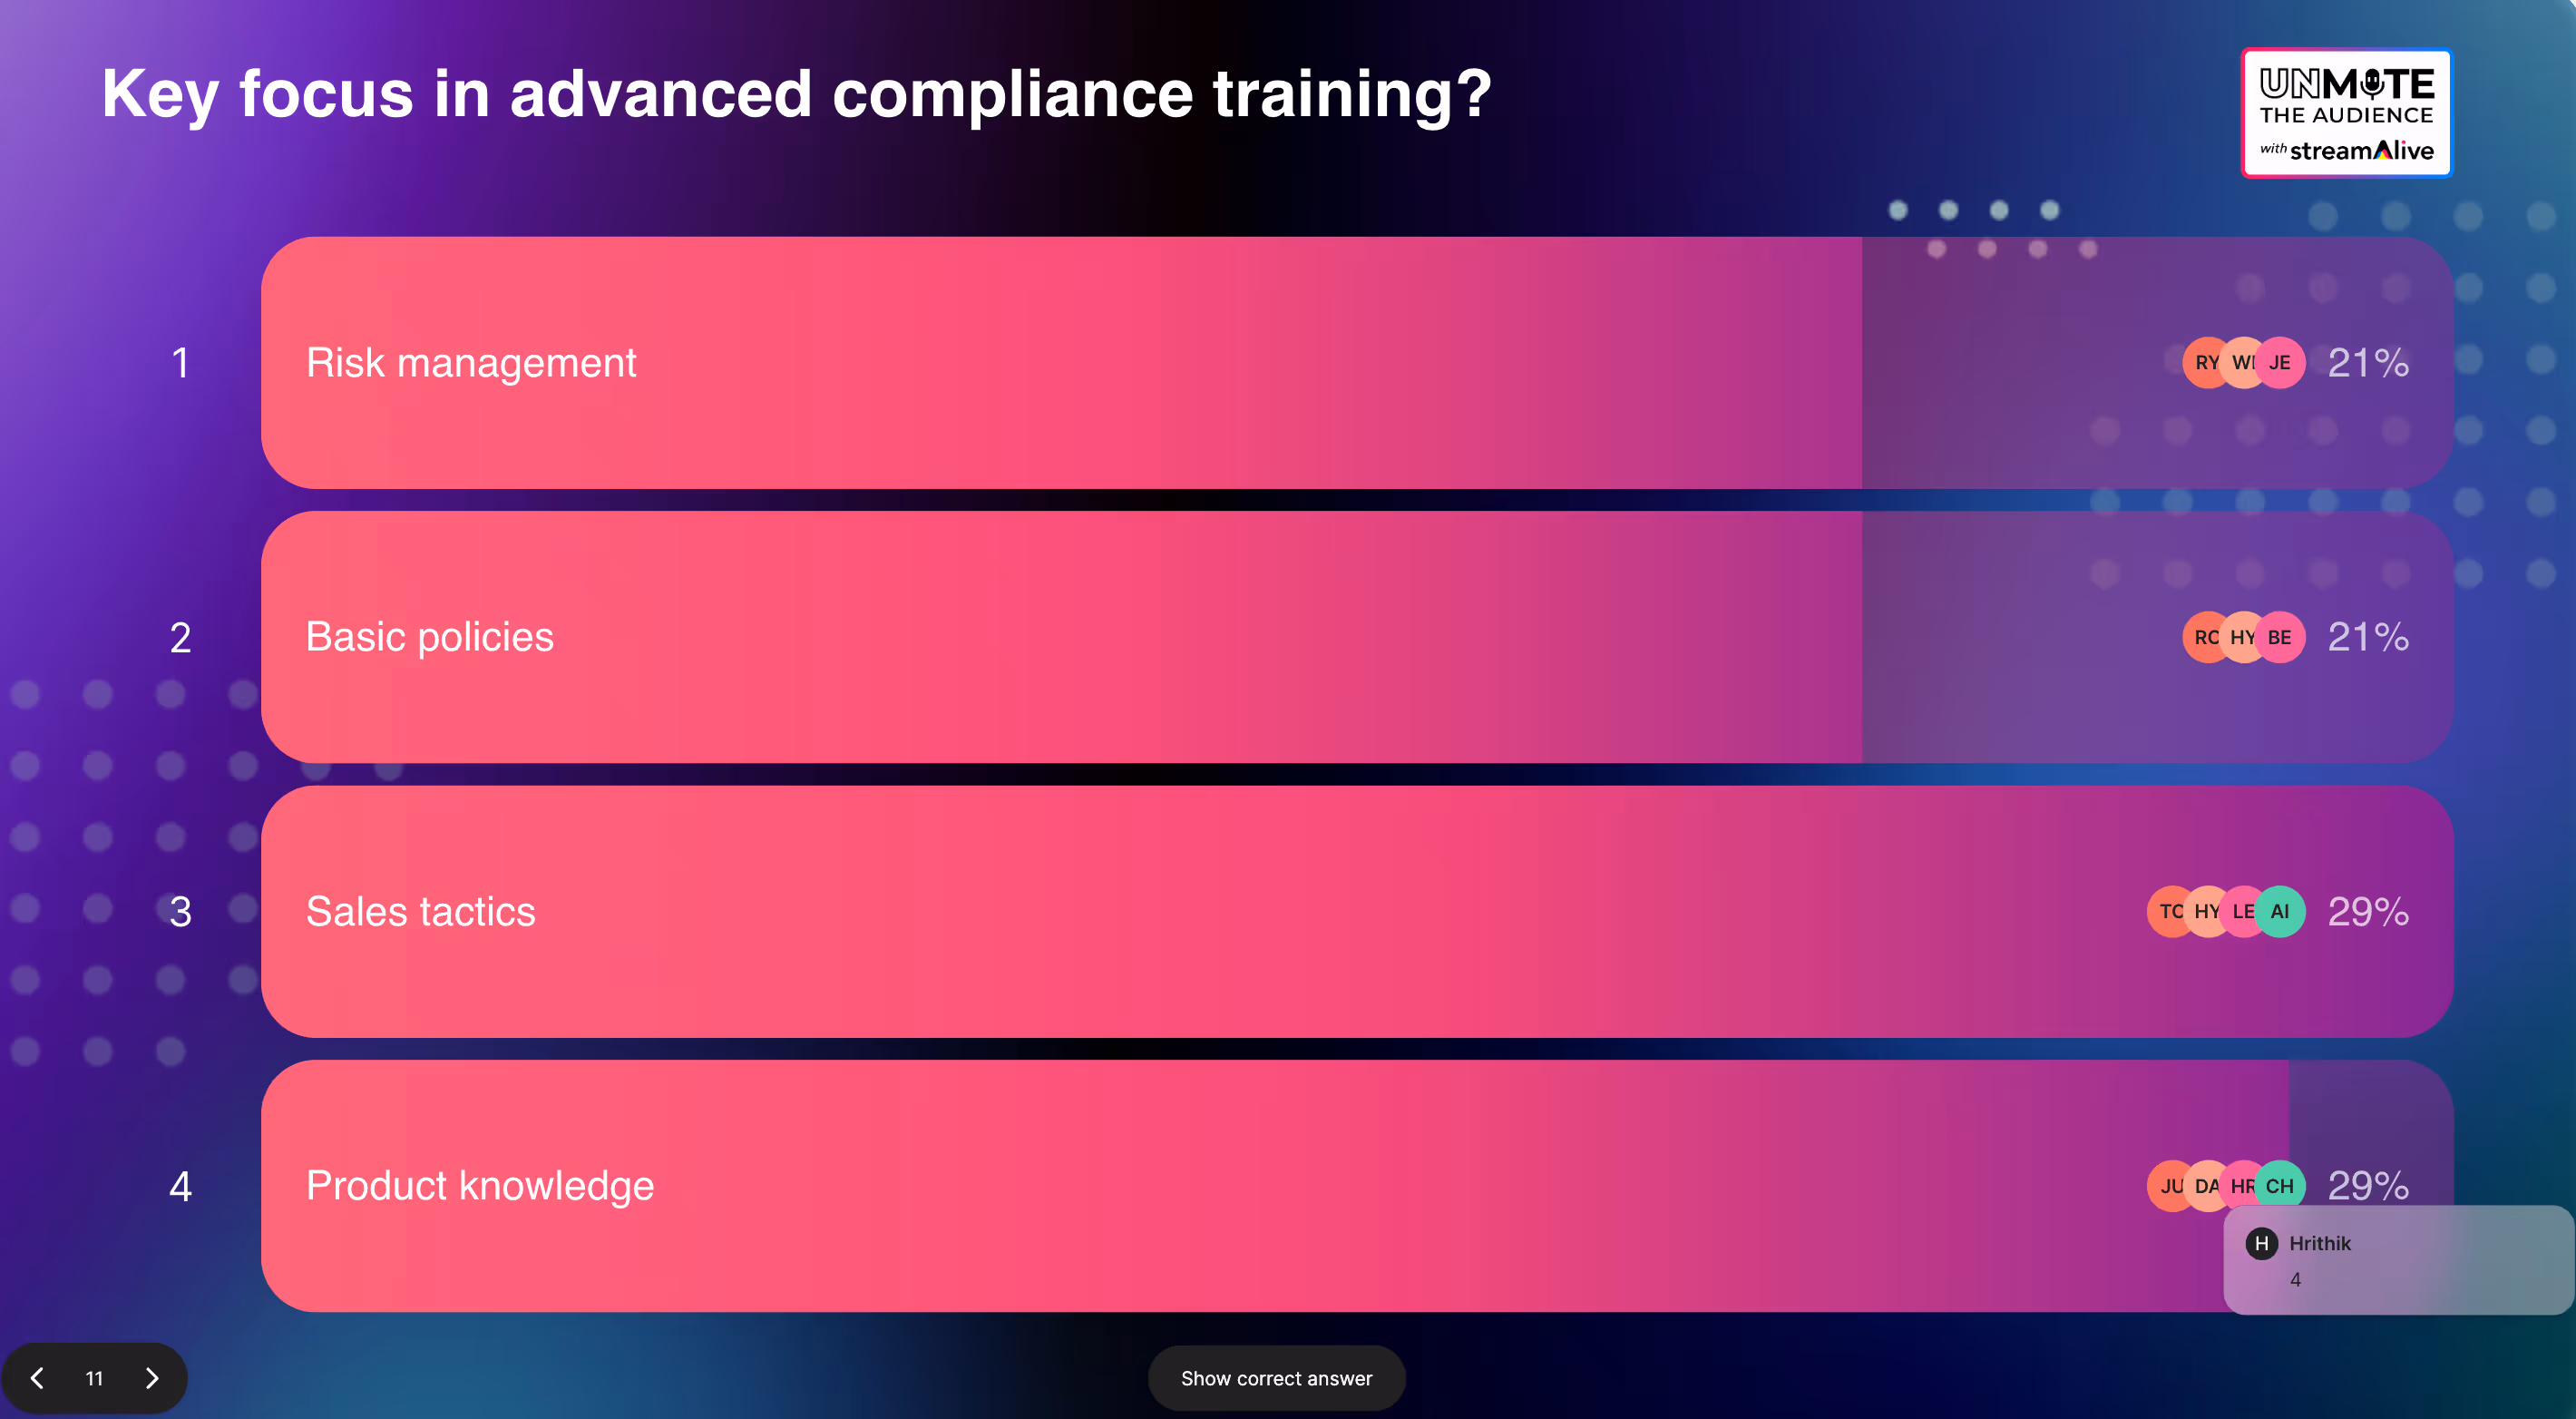
5) Power Polls: Let the audience steer what you go deeper on
Power Polls are perfect when you have limited time (always) and you want the room to feel like the session is tailored to them (because it is). You can pre-load options or even let StreamAlive pick answers from chat. How to use it in Impact Visualization training: - Direction-setting poll: What do you want most from today? Options example: 1) Building an impact story that leaders buy 2) Picking the right metrics (without drowning in data) 3) Mapping learning to business outcomes 4) Presenting impact visually (dashboards, one-pagers) - Decision poll: When leaders ask for ROI, what do you usually do? Options example: 1) Share completion and satisfaction 2) Share behavior/application evidence 3) Try to estimate ROI 4) Avoid the question (no shame) Trainer tip: Show results live and narrate them like a host: Alright, mapping to business outcomes is winning-so Ill spend extra time there and keep the dashboard part tighter. Instant engagement boost.
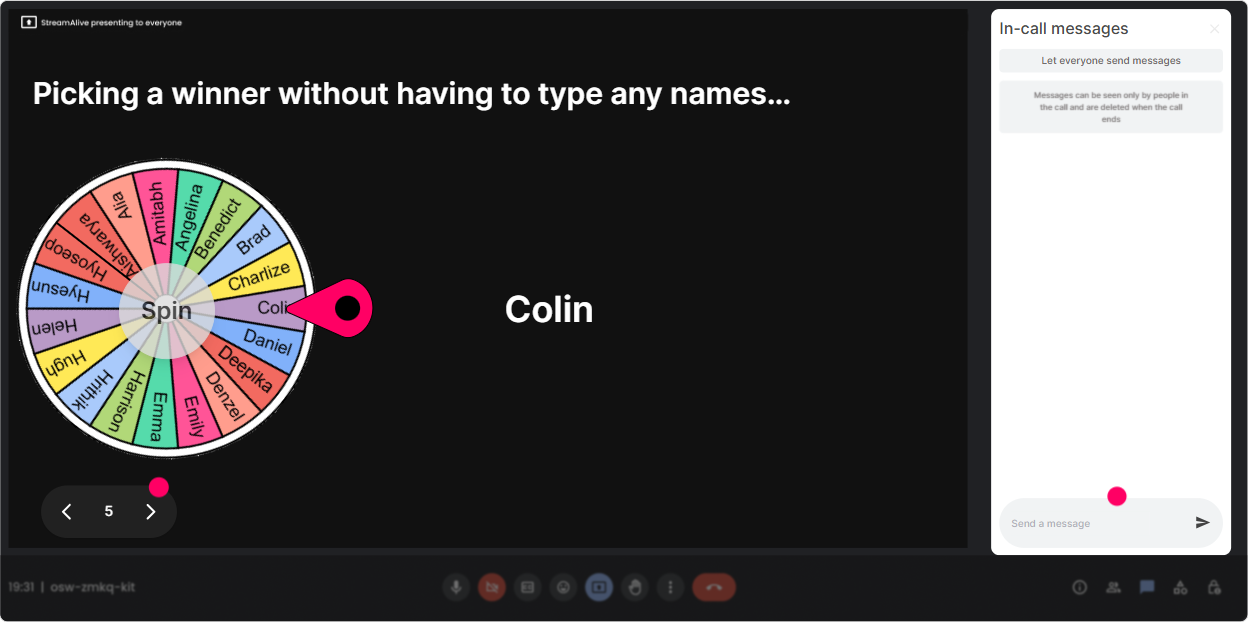
6) Winner Wheel: Get participation without calling on people randomly
Lets be real: asking for volunteers often gets you the same 2 brave souls. Winner Wheel fixes that by making participation feel fair and kind of fun-like, hey, the wheel chose you, not me. How to use it in Impact Visualization training: - After a chat prompt: Drop one metric you currently track for learning success. Then spin the wheel to pick someone to explain theirs. - For scenario practice: Type case if youre open to sharing your program. Ill spin and well use one real example to build an impact visualization live. - For reflection: Share one stakeholder you struggle with (CEO, HRBP, Finance, Ops). Wheel picks one person to elaborate. Trainer tip: Tie it to a light reward (even just bragging rights): Winner gets the unofficial title of Impact Champion of the Day. People participate more when it feels playful.
7) Quiz: Quick knowledge checks that dont feel like school
Quizzes keep attention sharp because people love finding out if theyre right-especially when its quick and visual. Use it to reinforce key concepts (and to catch misunderstandings early). How to use it in Impact Visualization training: - Concept check question: Which is the best example of an *outcome* metric? A) Course completions B) Learner satisfaction score C) Reduced time-to-proficiency D) Number of facilitator hours (Correct: C) - Stakeholder alignment: What should you define first when building an impact visualization? A) Dashboard tool B) Business goal C) Brand colors D) LMS report (Correct: B) Trainer tip: After you reveal the correct answer, dont move on too fast. Ask: If you picked A or B, what made you choose it? That mini-discussion is where the learning sticks.
2) Rating Polls: Quick pulse check on how confident people feel
Rating Polls are your best friend when you want instant truth without putting anyone on the spot. Youll quickly see if the room is already confident, totally new, or split-which helps you pace the session. How to use it in Impact Visualization training: - Opening baseline: On a scale of 110, how confident are you in *visualizing learning impact* today? - Mid-session check: How clear is the difference between outputs vs outcomes right now? (1 = still fuzzy, 10 = crystal clear) - After an activity: How ready are you to use Impact Visualization with your stakeholders next week? (110) Trainer tip: When you see a wide spread (some 2s and some 9s), say it out loud: Cool-this tells me weve got a mixed room, so Ill explain it two ways. That one sentence builds trust fast.
8) Q&A (Quick Questions): Catch every question without losing your flow
This is the feature that saves your brain. Instead of scanning chat like a maniac while you teach, StreamAlive detects and collects questions and shows them cleanly-so you can actually stay present. How to use it in Impact Visualization training: - Park questions during teaching: If you have a question, drop it in chat anytime-StreamAlive will catch it and Ill hit a Q&A break every 15 minutes. - Make Q&A structured: - Break 1: Questions about metrics and measurement? - Break 2: Questions about stakeholder storytelling and visualization? - End strong: Before we wrap, Im going to clear the question queue so nobody leaves stuck. Trainer tip: When people see their question pulled out and displayed, they trust the process more-and they ask better questions. That alone boosts engagement.

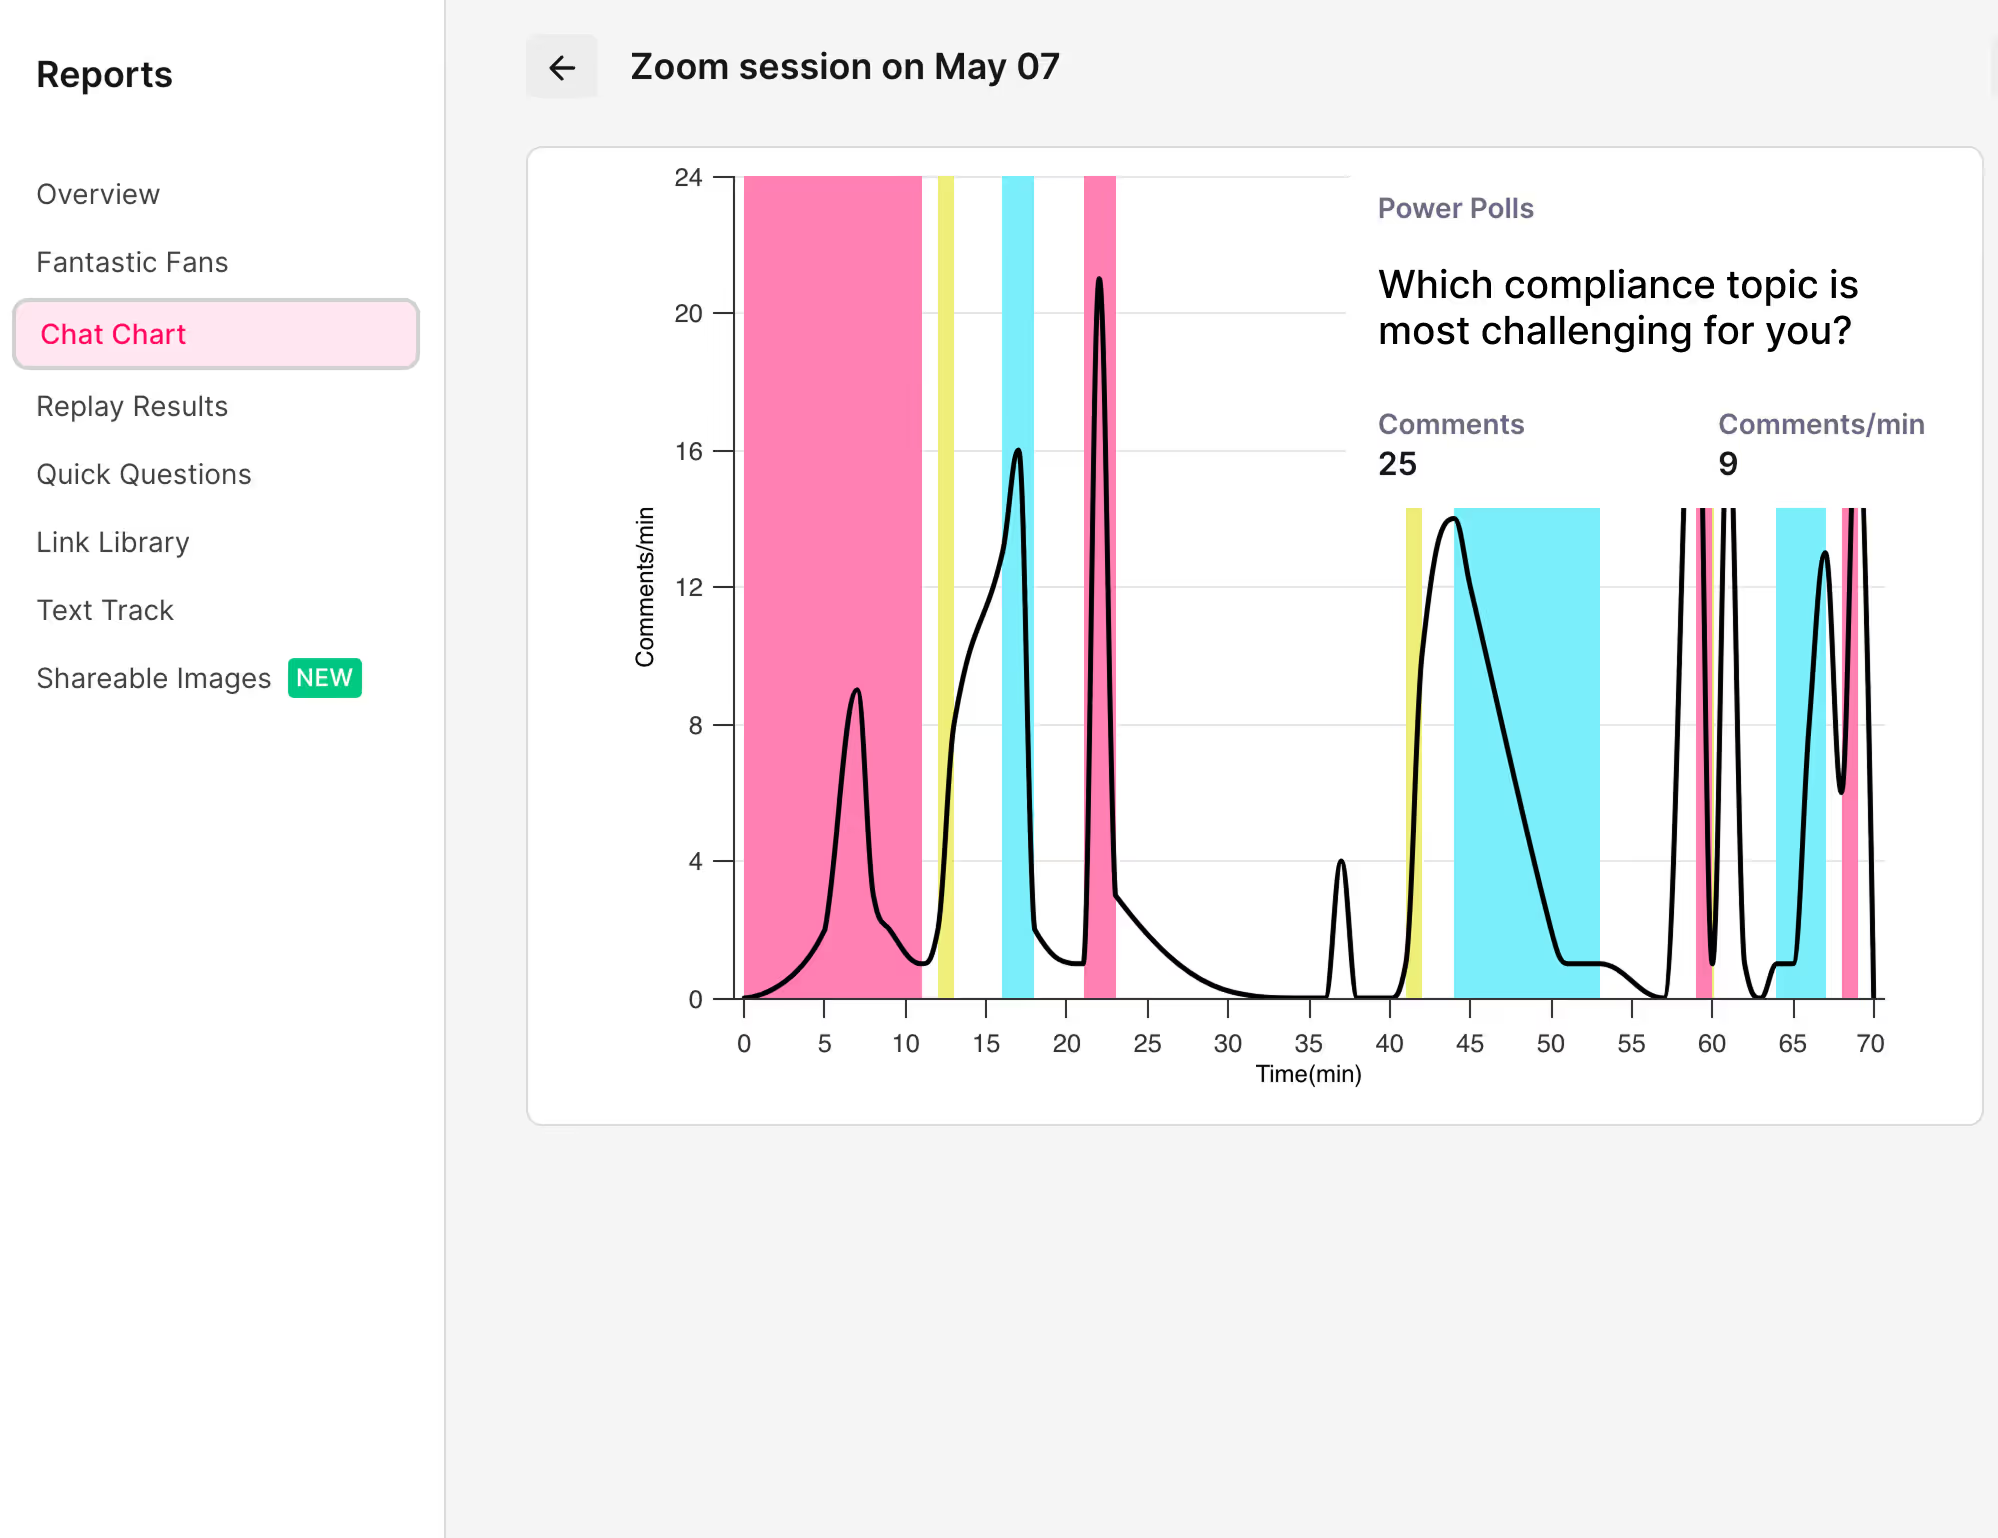
9) Analytics: Improve every cohort (and prove your session worked)
If youre training L&D Leaders, you already know this truth: what gets measured gets improved. StreamAlive analytics let you see exactly where engagement spiked, where it dipped, and who your most active participants were. How to use it after Impact Visualization training: - Minute-by-minute engagement: Spot the moments where chat exploded (thats your best content) and where it went quiet (thats where you tighten or add interaction). - Interaction reports: Compare which activities worked best-Word Cloud vs Poll vs Quiz-so your next session is even more engaging. - Identify your top fans: Find the most engaged participants (these are often your champions for spreading the approach inside the org). - Share insights: Email reports to yourself or your team, or use them to debrief what worked. Trainer tip: Use the analytics like a trainers highlight reel: When we did the stakeholder objections activity, engagement tripled-so next time Im bringing that earlier. Thats how your sessions get better fast-and how you drive up to 9x engagement over time by intentionally designing around what your audience actually responds to.
Use StreamAlive in all your training sessions
StreamAlive isn’t just for
Impact Visualization
training,
it can also be used for any instructor-led training session directly inside your PowerPoint presentation.
Explore similar traingin ideas: unlocking the potential of StreamAlive
See how StreamAlive transforms live training with engaging events and interactive sessions across industries, directly inside your PowerPoint presentation.
Interactions in action
(it's free)

.svg.png)


